
Most teams run on invisible processes. Even though work is technically happening, nobody can quite explain how. And when something breaks, it’s not clear where it went wrong. Process map templates solve this by giving you a pre-built framework that visualizes exactly how work flows through your organization. They define who does what, when, and what happens next.
This guide covers 10 essential process map templates, explores how to create effective maps, and shows you how to turn static diagrams into workflows you can use. You’ll see which template fits different scenarios, decode the symbols that make maps readable, and learn how platforms turn documented processes into automated systems.
Try monday work managementKey takeaways
- Transform static documentation into living workflows: Connect your process maps directly to daily work execution, turning diagrams into actionable systems that teams use and follow.
- Save hours with ready-made frameworks: Skip the blank page problem by using proven templates that let you focus on content instead of design, cutting mapping time from days to hours.
- Spot bottlenecks and inefficiencies instantly: Visual process maps expose delays, redundant approvals, and workflow loops that go unnoticed in daily execution, making optimization targets obvious.
- Build executable processes with monday work management: Turn process maps into automated workflows where tasks trigger notifications, status updates happen automatically, and real-time dashboards track performance.
- Standardize processes across your entire organization: Use consistent templates and symbols so every team documents workflows the same way, which enhances cross-functional understanding and helps scale operations.
What is a process map template?
A process map template is a pre-built framework that visualizes the step-by-step flow of a business activity from start to finish. It provides a standardized structure for documenting tasks, decision points, responsibilities, and timing so teams can skip the design phase and jump straight to content. These templates show how value moves through your organization, making sure every stakeholder knows their role.
Think of it as scaffolding for your workflows. Instead of starting from scratch every time you need to document a process, you have a proven structure that captures all the essential elements while leaving room for customization.
Process map vs. flowchart
While people often use these terms interchangeably, process maps and flowcharts do different things. A flowchart is a broad diagram representing any sequence of logical steps or decisions, often used for algorithms or simple instruction sets, and is a key component of a process mapping framework. A process map zeroes in on business operations, highlighting stakeholder roles, timing, and the inputs and outputs needed at each stage.
| Feature | Process map | Flowchart |
|---|---|---|
| Primary focus | Business operations, roles, and value flow | Logic sequences and decision trees |
| Detail level | High; includes timing, resources, and inputs | Variable; often simplified for quick scanning |
| Audience | Operations managers, stakeholders, auditors | General audience, developers, casual users |
| Key use case | Process optimization, compliance, onboarding | Troubleshooting, algorithm design, basic instruction |
Key components every process map needs
Every effective process map contains specific elements that turn abstract workflows into documentation you can use. Understanding these components helps your maps capture the full picture of how work moves through your organization.
- Start and end points: Defined boundaries that trigger the process and signal its completion prevent scope creep and keep the map focused on a specific outcome.
- Process steps: Discrete actions or tasks that move the workflow forward are documented in sequence to create an unambiguous chain of events.
- Decision points: Moments where the process branches based on specific criteria show the logic and alternative paths within the workflow.
- Stakeholders and roles: Identifying who’s responsible for each step creates accountability and seamless handoffs between departments or individuals.
- Inputs and outputs: Specifying the data, materials, or information needed to start a task and what is produced when it’s done sets quality standards.
- Flow direction: Visual indicators, usually arrows, show the chronological progression of work, so the order of operations is always understood.
When to use process map templates
Process map templates work across multiple scenarios. Knowing when to use them helps teams get the most from their documentation and create workflows that drive results.
- New process documentation: Capturing a workflow for the first time needs a structure that catches every critical step and role
- Process improvement initiatives: Visualizing the current state reveals bottlenecks and redundancies you’d never spot in text-based documentation
- Team onboarding: Giving new hires a visual map of their responsibilities speeds up learning and cuts down on tribal knowledge
- Compliance requirements: Audits often require standardized documentation of procedures to show you’re consistently meeting regulatory standards
- Cross-departmental workflow design: Mapping handoffs between teams makes expectations clear and cuts friction where teams intersect

5 key benefits of process map templates
Adopting process map templates shifts an organization from reacting to problems to designing solutions. The value is in the operational insights and alignment that mapping creates. These benefits build over time, creating a foundation for lasting operational excellence.
Save hours with ready-made frameworks
Templates eliminate the blank page problem, letting teams skip structure design and jump straight to filling in the details. Using a pre-built framework cuts the time spent on formatting and layout, often shrinking initial mapping time from days to hours. This efficiency lets teams document more processes in less time, speeding up standardization.
Standardize processes across teams
Templates create a consistent language and format for documentation across the entire organization. When every department uses the same structure, cross-functional understanding improves, and employees can easily interpret workflows from other teams. This standardization is important when you’re scaling operations and keeping quality control tight as the organization grows.
Visualize workflows for improved understanding
Visual information gets processed way faster than text, making complex workflows easier to grasp at a glance. A process map turns pages of dense procedure manuals into a single, scannable image that highlights relationships and dependencies. This visibility boosts stakeholder buy-in and gives everyone a shared understanding.
Spot bottlenecks and inefficiencies fast
Visualizing a process exposes delays, redundant approvals, and illogical loops you’d never notice in daily execution. Bottlenecks show up visually as clusters of arrows or stacked decision points, immediately highlighting where work is getting stuck. Spotting these friction points is the first step toward targeted optimization and smarter resource allocation.
Enable data-driven process improvement
A structured process map gives you the foundation for measuring performance and making continuous improvements. Once you’ve defined a process, teams can attach metrics like cycle time or error rates to specific steps. This turns the map from a static picture into a baseline for analyzing performance and testing the impact of changes.

10 essential process map templates
Different workflows require different visualization approaches. This gallery covers the most essential templates, from simple linear flows to complex, multi-layered diagrams that capture the details of enterprise operations. Each template fits specific organizational needs and complexity levels.
Basic process map template
A basic process map is the starting point for straightforward, linear workflows. It uses a simple start-to-end structure, making it ideal for processes with few decision points and limited stakeholders. This template works best for documenting simple tasks or high-level overviews where you want to keep complexity low.
Detailed process map template
Complex processes that need comprehensive documentation call for a detailed process map. This template builds on the basic version by adding granular details like task duration, specific resources, detailed instructions, and required inputs/outputs for every step. You’ll need this when the map doubles as a training manual or when precision matters for compliance.
Swimlane process map template
For cross-functional processes, swimlane maps that visualize handoffs organize the workflow by responsible parties, using horizontal or vertical lanes to separate departments or roles. This format is essential for cross-functional processes, as it visualizes handoffs and accountability. It immediately highlights where communication breakdowns occur between teams and links every step to an owner.
Value stream mapping template
Value stream mapping focuses on the flow of value to the customer. It distinguishes between value-added activities and non-value-added waste, helping teams identify opportunities to optimize operations. Originally from manufacturing, this template is now widely used in service industries to optimize delivery speed and quality.
SIPOC process map template
SIPOC stands for Suppliers, Inputs, Process, Outputs, and Customers. This high-level template provides a bird’s-eye view of a process, defining the scope and key relationships before work on building a detailed process map begins. It proves particularly useful during the project definition phase to align stakeholders on what the process entails and who it serves.
Business process map sample
This general-purpose template strikes a balance between simplicity and detail, suitable for the majority of standard organizational workflows. It includes standard symbols for tasks, decisions, and documents, making it versatile for administrative, operational, or management processes. It serves as the default choice for documenting business-as-usual activities.
Workflow process map template
Workflow maps focus specifically on the sequence of tasks and the movement of data or documents between steps. Unlike general process maps, they emphasize the mechanics of execution. This template often becomes the precursor to setting up workflow automation in digital platforms.
Cross-functional process map
Similar to swimlanes, this template specifically addresses processes that span multiple departments, but with a focus on the interaction points. It highlights the dependencies and communication requirements between teams, making it ideal for complex projects like product launches or enterprise-wide implementations.
High-level process map format
The high-level map acts as an executive summary, showing only the major phases of a process without the granular steps. It proves appropriate for strategic planning sessions and stakeholder presentations where the goal is to communicate the general concept or flow without getting bogged down in operational minutiae.
Current state and future state maps
This paired approach is fundamental to change management. The current state map documents the process as it exists today, while the future state map designs the idealized, improved version. Comparing the two highlights the gap that needs to be bridged and guides the implementation plan.
How to create a process map in 5 steps
Creating an effective process map requires a structured approach to ensure accuracy and usability. These steps apply regardless of the specific template or platform selected. Following this methodology helps teams avoid common pitfalls and creates documentation that drives operational improvement.
Step 1: Define process start and end points
Establishing boundaries is the first and most critical step. The start point (trigger) and end point (outcome) define the scope of the map.
Key considerations for boundary setting:
- Identify the trigger event: What specific action or condition initiates this process?
- Define completion criteria: What measurable outcome signals the process is finished?
- Avoid scope creep: Resist the temptation to include related but separate workflows
Ambiguous boundaries lead to scope creep, where the map expands to cover unrelated activities, or scope gaps, where critical triggers are missed.
Step 2: Identify process stakeholders and roles
Mapping requires input from everyone who touches the process. Identifying all participants, including those who execute tasks, those who make decisions, and those who receive information, ensures the map reflects reality.
Stakeholder identification checklist:
- Primary actors: Who performs the main tasks?
- Decision makers: Who approves or rejects at key points?
- Information recipients: Who needs updates or notifications?
- Support roles: Who provides resources or assistance?
This step often involves interviewing team members to understand their specific contributions and handoffs.
Step 3: Document each process step
The core of the map involves breaking down the workflow into discrete, actionable steps. The level of detail should be consistent throughout.
Documentation best practices:
- Use action-oriented language (e.g., “review proposal” not “proposal review”)
- Maintain consistent detail levels across all steps
- Include timing estimates where relevant
- Specify required resources or tools
Step 4: Map decision points and alternative paths
Processes rarely follow a single straight line. Identifying decision points, where the flow branches based on specific criteria, is essential for capturing the full logic of the workflow.
Decision mapping elements:
- Decision criteria: What specific conditions determine the path?
- Alternative outcomes: What happens in each scenario?
- Exception handling: How are unusual situations managed?
- Feedback loops: Where does the process circle back to earlier steps?
This includes documenting exception paths to keep the process robust enough to handle reality.
Step 5: Validate and refine your process map
A map created in isolation is rarely accurate. The final step involves walking through the map with the actual process participants to validate it matches their daily reality.
Validation activities:
- Walkthrough sessions: Review each step with process participants
- Reality testing: Compare the map against actual work patterns
- Gap identification: Note discrepancies between documented and actual processes
- Refinement cycles: Update the map based on feedback
Feedback from this review refines the steps, corrects misunderstandings, and ensures the final document is a reliable source of truth.
Try monday work management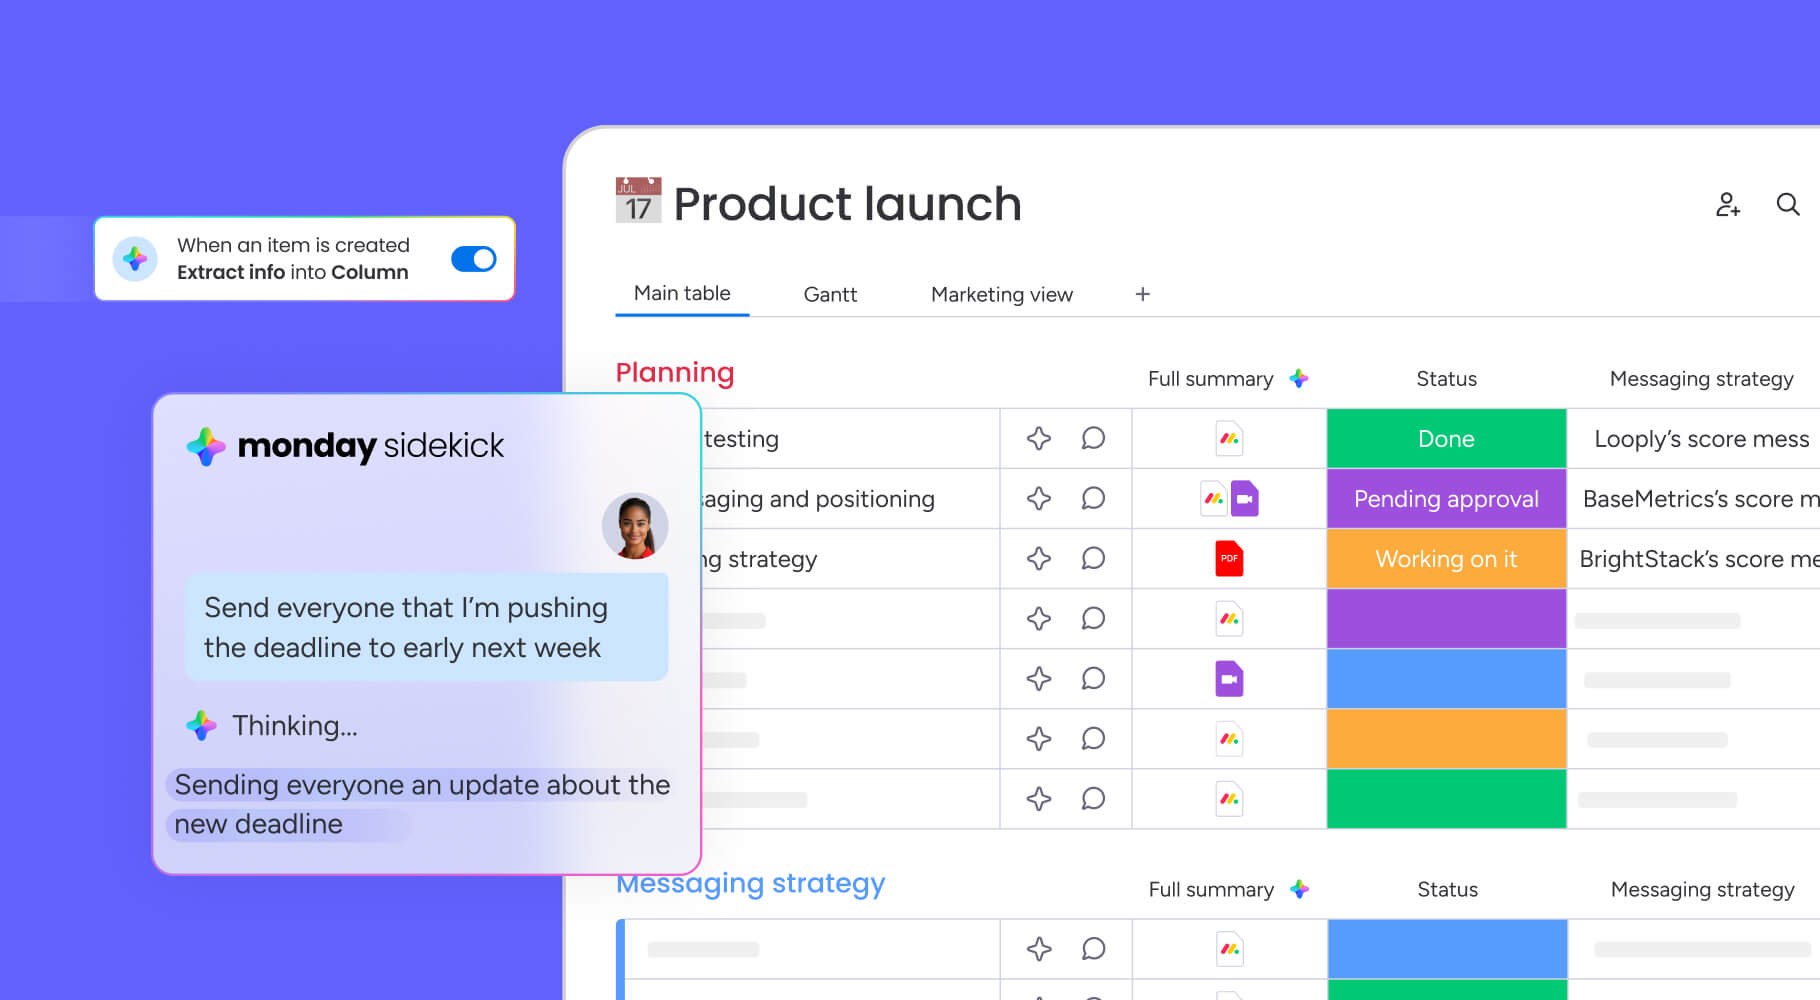
Process mapping symbols made simple
Standardized symbols act as a universal language, ensuring that process maps are readable by anyone, regardless of their department or background. Understanding these symbols is essential for both creating and interpreting process documentation. Consistency in symbol usage lets all teams interpret workflows uniformly across different departments.
Start and end point symbols
Ovals or rounded rectangles represent the start and end points of a process. These terminators signal the boundaries of the workflow. A map typically has one start point but may have multiple end points depending on the outcomes of decision paths.
Process step and activity boxes
Rectangles represent specific actions, tasks, or operations within the process. These are the most common symbols and contain brief descriptions of the activity being performed. The size of the box should be consistent, with text concise enough to be read easily.
Decision diamond symbols
Diamonds indicate a point where a decision must be made, typically resulting in a yes/no or pass/fail branch. Arrows extending from the diamond represent the different paths the process can take based on the decision outcome.
Flow direction arrows
Arrows connect the symbols and indicate the direction of the workflow. Solid lines typically represent the primary flow, while different line styles can indicate feedback loops or secondary paths. Routing arrows with precision is essential for readability.
Document and data symbols
Specific shapes, often resembling a piece of paper or a cylinder, represent documents and data storage. These symbols highlight where information enters or leaves the process, specifying input/output requirements.
Connector and subprocess links
Small circles or pentagons serve as connectors, indicating that the flow continues on another page or links to a separate, detailed subprocess map. This keeps the main map clean while allowing for layered complexity where necessary.
Move from static maps to living workflows with monday work management
While a diagram on a wall provides reference, a living workflow drives action. As a dynamic alternative to static diagrams, monday work management transforms how teams turn process maps into action, connecting documentation directly to daily execution through visual boards, automation, and real-time collaboration. Here’s how monday work management creates an operational engine for your team.
Connect process maps to daily work
Linking the documented process directly to the task management system bridges the gap between theory and practice. When the map is the interface for doing the work, compliance becomes automatic, and the process is reinforced with every task.
Organizations using monday work management can build processes that translate directly into board structures where:
- Items represent tasks: Each process step becomes a trackable work item
- Columns represent data stages: Status updates reflect process progression
- Groups represent process phases: Major workflow sections organize related activities
Automate process steps and approvals
Routine steps and handoffs documented in the map can often be automated. Moving from manual emails to automated triggers reduces administrative burden, eliminates human error, and speeds up execution.
Teams using monday work management can instantly:
- Notify stakeholders: Automatically alert the next person when a task is complete
- Create follow-up tasks: Generate new items on different boards based on process logic
- Update status fields: Change project status automatically based on completion criteria
This seamless connectivity creates smooth manual handoffs and ensures every request is tracked and managed between teams.
Monitor real-time process performance
Living workflows generate data. Instead of guessing where bottlenecks are, teams can see real-time performance metrics. This visibility allows for proactive management and immediate intervention when issues arise.
Performance monitoring capabilities:
- Cycle time tracking: Measure how long each process step takes
- Bottleneck identification: Spot where work accumulates
- Capacity monitoring: Track team workload and availability
- Quality metrics: Monitor error rates and rework frequency
Dashboards in monday work management provide a live view of process health, allowing leaders to visualize cycle times, identify stages where work is piling up, and monitor team capacity.
Leverage AI for process optimization
Artificial intelligence can analyze the data generated by living workflows to suggest improvements. AI capabilities can identify patterns, predict delays, and even categorize unstructured data, turning process execution into a source of continuous learning.
Portfolio Risk Insights in monday work management scan project boards to flag potential risks by severity, giving teams an automated, at-a-glance view of critical issues.
Try monday work management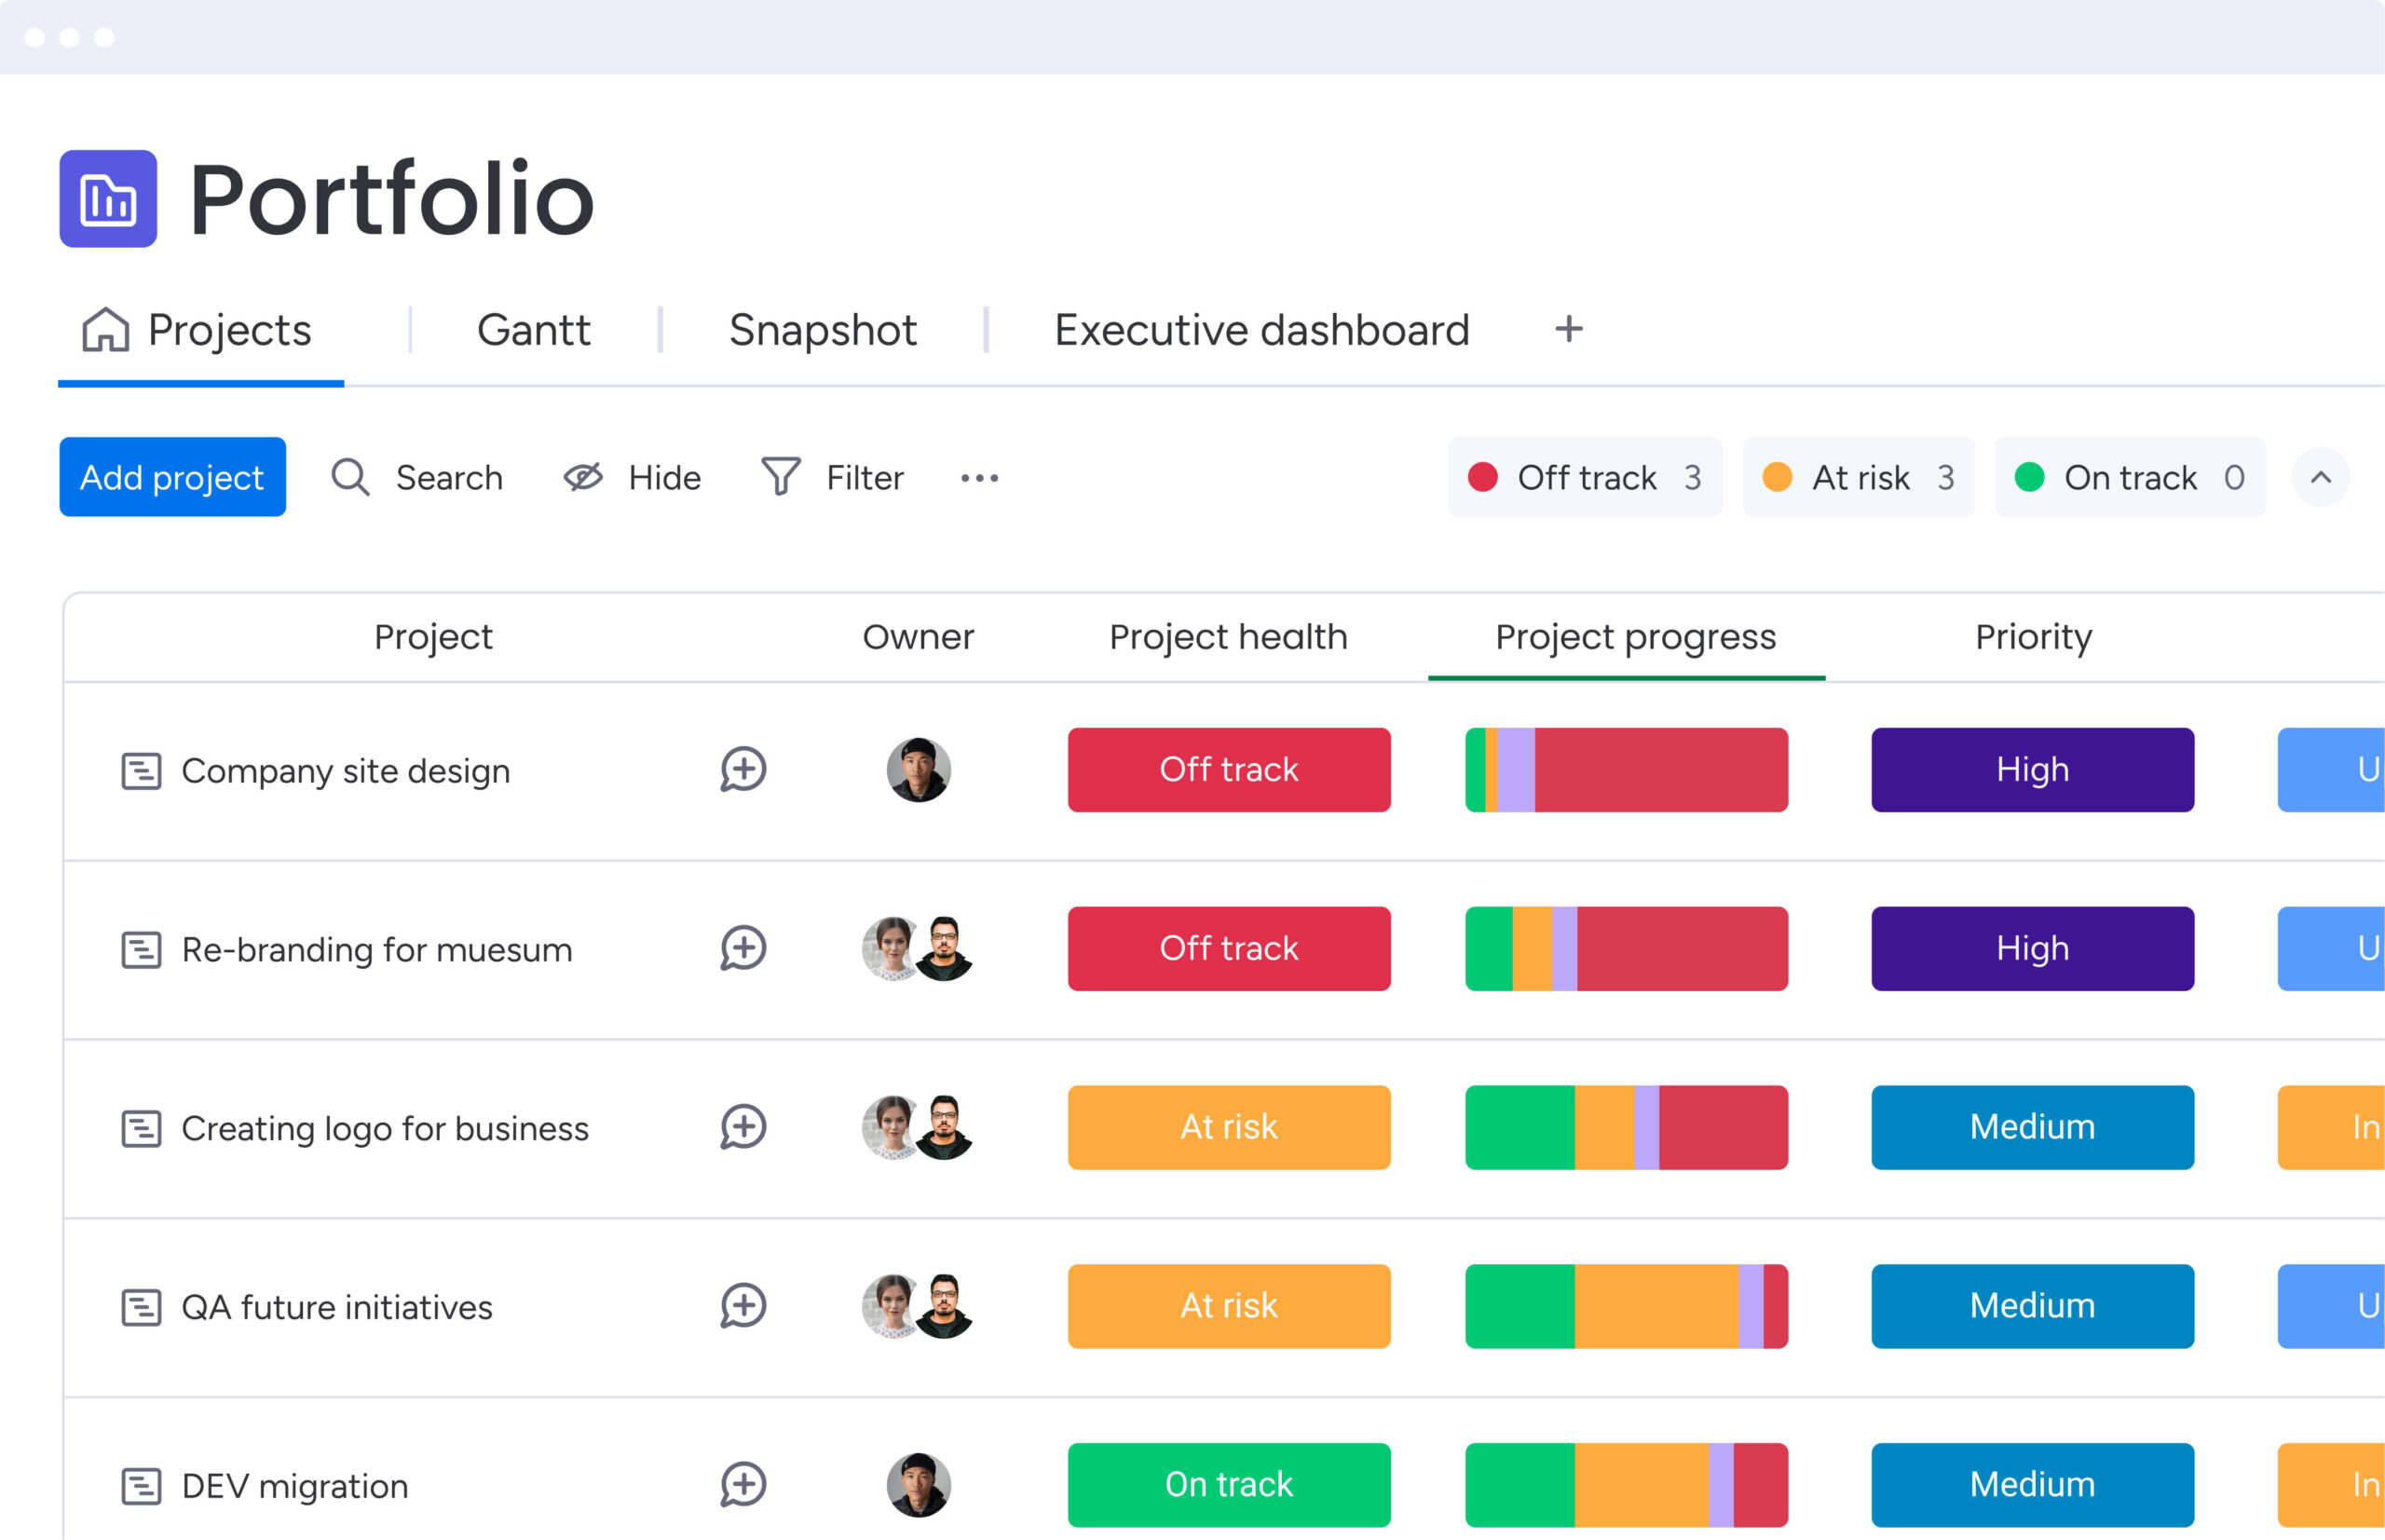
Transform process mapping into operational advantage
Process map templates are the foundation for how work gets done. When you move from static diagrams to executable workflows, you unlock real process management: visual clarity, standardized execution, and data-driven optimization that builds competitive advantageover time.
monday work management turns process maps into operational engines. Connecting process design directly to daily execution, workflows become living systems your team uses, with automation that brings maps to life and real-time visibility that drives continuous improvement.
Try monday work managementFrequently asked questions
How do you create a process map template?
Creating a process map template involves defining the process scope, identifying stakeholders, documenting sequential steps, adding decision logic, and validating the flow with users. Templates can be built in various platforms, from simple diagramming apps to integrated work management systems.
Can I make a process map in Word?
Yes, Microsoft Word can create basic process maps using its built-in shapes and SmartArt features. However, it lacks the advanced functionality required for complex process documentation, real-time collaboration, or workflow execution.
Does PowerPoint have a process map template?
PowerPoint includes basic process templates and SmartArt graphics suitable for presentations. While effective for high-level communication, it lacks the depth needed for detailed process documentation or managing active workflows.
Can I create a process map in Excel?
Excel allows for the creation of simple process maps using shape overlays and flowchart elements. Despite this capability, it lacks the intuitive visual design and collaborative features found in dedicated process mapping software.
What is the difference between a process map and a flowchart?
A process map is a specific type of diagram focused on business operations, detailing stakeholder roles, inputs, and handoffs. A flowchart is a broader term for any diagram representing a logical sequence or decision tree, regardless of context.
How does monday work management support process mapping?
monday work management combines visual process design with executable workflows, allowing teams to turn static maps into active systems. The platform supports this with built-in automation, real-time tracking, and collaborative features that drive process efficiency.